Mind
Price Action Trading: How to Read Candles Without Memorizing Patterns

You don't need 47 candlestick names. You need three questions: where are we, who's pushing, and did it work?
Educational only, not financial advice (disclaimer).
There are books with hundreds of candlestick patterns. Hammers, dojis, three black crows, abandoned babies.
Here’s the honest take: most of those names don’t do much on their own. Studies testing classic patterns as standalone signals have found mixed results at best. What does matter is something simpler: what price does, where it does it, and what happens next.
That’s price action.
Location first, pattern second
The same candle means different things in different places.
A long lower wick in the middle of nowhere is just noise. The same wick right at yesterday’s value area low, or at the last higher low in an uptrend, is a clue that buyers defended a level that matters.
So before you look at the candle, ask: Is this happening somewhere important? If the answer is no, the candle barely matters.
Three things every candle tells you
You can read any bar with three simple questions.
1. How big is the range? Wide bars mean urgency. Somebody needed in or out now. Narrow bars mean hesitation or agreement.
2. Where did it close? A bar that closes near its high says buyers held control into the close. One that closes near its low says sellers did. A close in the middle says nobody won.
3. Where are the wicks? A wick is a price that was tried and rejected. A long upper wick means price went up, looked around, and got sold back down.
Put those together and you’re reading the auction one bar at a time.
Momentum vs. pullbacks
Strong moves usually show wide bars, closes near the extremes, and little overlap. Each bar starts roughly where the last one ended.
Pullbacks within a trend usually show smaller bars, more overlap, and mixed closes. That’s profit-taking, not a new army of sellers.
When a pullback starts to look like a momentum move in the other direction (wide bars, strong closes against the trend), take note. The character just changed.
The failed breakout: price action’s best story
Every trader watches the obvious levels. Prior high. Prior low. Round numbers. That’s exactly why so much happens there.
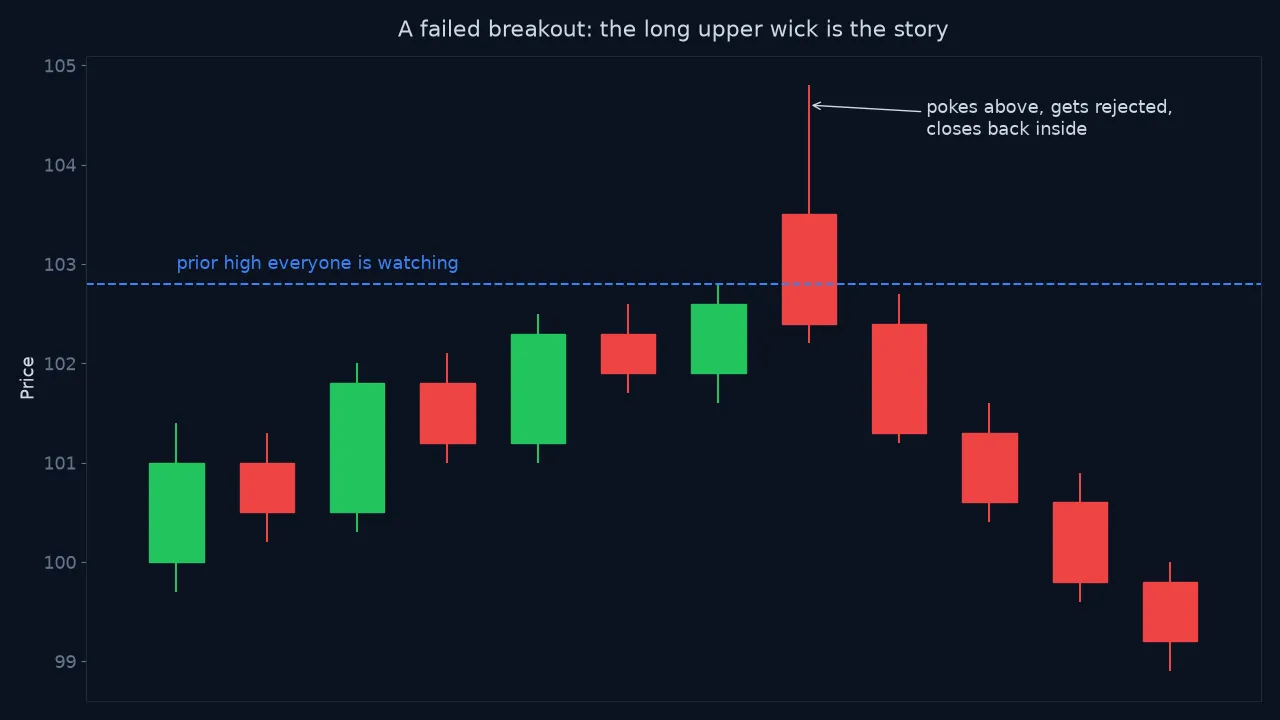
Here’s how a failed breakout plays out:
- Price pushes above a well-watched high.
- Breakout traders buy. Shorts get stopped out, which adds more buying.
- Then… nothing. No follow-through. No new buyers.
- Price closes back inside the range, often with a long upper wick.
- Now the breakout buyers are trapped above, and their stops sit below.
In auction terms, the market advertised higher prices and got no response. That’s rejection. Failed breakouts are common precisely because markets spend most of their time in balance.
The flip side: when a breakout holds, retests the level, and builds there, that’s acceptance. Those are the ones that run.
Keep it simple enough to repeat
The best price action traders tend to have a small playbook. Maybe two or three setups they know cold. For example:
- Pullback to a key level in a trend, with a bar that rejects the level.
- Failed breakout of a range edge.
- Breakout that retests and holds.
Write yours down. Screenshot every example. Grade them in your trading journal. After 50 examples you’ll know more about your setup than any pattern book can teach you.
The mental side
Price action is discretionary, which means you are part of the system. A tired, tilted, or FOMO-driven brain reads the same chart very differently from a calm one. You’ll see “rejection” everywhere when you want to short, and “support” everywhere when you’re already long.
The fix isn’t to stop using judgment. It’s to define your setups clearly enough that a stranger could check them, and to stop trading when you notice the story in your head getting louder than the chart.
Quick recap
- Location beats pattern names. A candle matters only at a level that matters.
- Read every bar with three questions: range, close, wicks.
- Momentum = wide bars, strong closes, little overlap. Pullbacks = small, overlapping bars.
- Failed breakouts are one of the clearest stories on any chart.
- Keep a small playbook and journal it. Next, add the clock: price and time.
Educational content, not financial advice. See our disclaimer.
FAQ
What is price action trading?
Price action trading means making decisions mainly from the movement of price itself, such as candle ranges, closes, wicks and how price reacts at key levels, rather than relying on lagging indicators.
Do candlestick patterns work?
On their own, out of context, the evidence for most named candlestick patterns is weak. They tend to be more useful as a read on behavior at important levels than as standalone signals.
What is a failed breakout?
A failed breakout is when price moves past a well-watched level, such as a prior high, but can't hold there and closes back inside the range. It often traps traders who bought the breakout.
Up next · 4 minPrice and Time in Trading: Why When Matters as Much as Where