Mind
Market Structure Trading: Highs, Lows and the Story of Every Trend

Before indicators, before patterns, there's structure. Higher highs, higher lows, and the exact moment the story changes.
Educational only, not financial advice (disclaimer).
Strip every indicator off your chart. No moving averages, no RSI, no colored clouds.
What’s left still tells a story. Price goes up, pulls back, goes up again. Or it bounces between two levels like a pinball. That skeleton is market structure, and it’s the first thing a good discretionary trader reads.
Swing highs and swing lows
A swing high is a peak with lower prices on both sides. A swing low is a dip with higher prices on both sides. Connect them and you get the zigzag that every trend is built from.
There’s no single official definition of how big a swing has to be. Some traders use a fixed number of candles on each side. Some eyeball it. Pick a rule and stay consistent, because consistency is what makes your read repeatable.
The three states
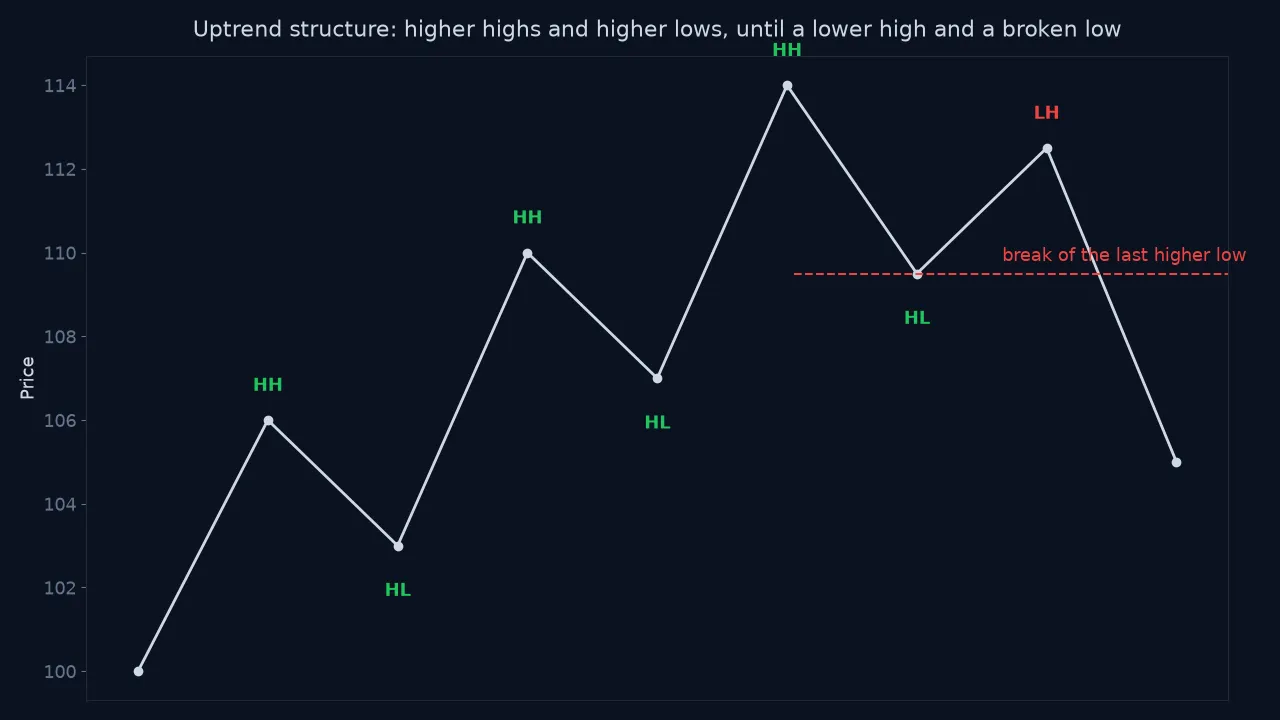
Uptrend: higher highs (HH) and higher lows (HL). Buyers keep paying more, and sellers can’t push price back to where it was.
Downtrend: lower highs (LH) and lower lows (LL). The mirror image.
Range: highs and lows at roughly the same levels. Neither side is winning. In auction terms, the market is in balance.
This idea is old. It goes back to Charles Dow’s writing around 1900 and sits at the center of what’s now called Dow Theory. It’s survived for more than a century because it describes something real: who’s winning the fight.
The level that matters most
In an uptrend, the most important level isn’t the high. It’s the most recent higher low.
Why? Because that’s where buyers last stepped in with enough force to send price to a new high. If price falls back through it, those buyers have been overwhelmed. That’s called a break of structure.
A break doesn’t mean the trend has flipped. It means the trend is in question. Often you’ll see a lower high form next, and only then a clear change in character.
Pullback or reversal?
This is the question that costs traders the most money. A few clues help:
- Depth. Healthy pullbacks often retrace part of the prior leg and hold above the last higher low. Deep ones that slice through it deserve suspicion.
- Speed. A slow, overlapping drift down into support looks like profit-taking. A fast, wide-range drop looks like new sellers.
- Location. A pullback into a prior breakout level or the value area has a reason to hold. One into empty space doesn’t.
- What happens next. Does price bounce and make a new high? Or stall and roll over? The market answers the question for you if you’re patient.
Timeframes stack
Structure is fractal. A daily uptrend contains 15-minute downtrends. That’s not a contradiction. It’s just zoom.
A simple approach that works for a lot of discretionary traders:
- Higher timeframe for direction. Daily or 4-hour. Is it trending or ranging?
- Middle timeframe for the setup. Where’s the pullback likely to end?
- Lower timeframe for the trigger. When does the small structure flip back in your favor?
When all three agree, you’ve got wind at your back. When they fight, size down or sit out.
The psychology hiding in structure
Here’s why structure is more than lines on a chart. Every swing point is a spot where real people made decisions and placed stops.
Buyers who bought the last higher low usually have their stops just below it. That’s why price often wicks through those levels before reversing, or breaks them and accelerates. Knowing this helps you place your own stop somewhere that isn’t the most obvious spot in the building.
It also helps you stay calm. If your plan says “I’m wrong if the higher low breaks,” then everything before that is just noise. That’s the core of trading discipline: a clear line in the sand, decided before you enter.
Quick recap
- Structure = the pattern of swing highs and lows.
- Uptrend: HH + HL. Downtrend: LH + LL. Range: flat highs and lows.
- The last higher low (or lower high) is the level that matters most.
- Use a higher timeframe for context, lower for timing.
- Pair this with price action to read what happens at each level.
Educational content, not financial advice. See our disclaimer.
FAQ
What is market structure in trading?
Market structure is the pattern of swing highs and swing lows on a chart. An uptrend makes higher highs and higher lows, a downtrend makes lower highs and lower lows, and a range makes highs and lows at roughly the same levels.
What is a break of structure?
A break of structure is when price moves past a key swing point that defined the trend, such as an uptrend breaking below its most recent higher low. It suggests the side in control may be losing its grip.
Which timeframe should I use for market structure?
Start with a higher timeframe to set context, such as daily or 4-hour, then use a lower timeframe to time entries. Structure on a 1-minute chart can contradict structure on a daily chart, and the higher timeframe usually carries more weight.
Up next · 4 minPrice Action Trading: How to Read Candles Without Memorizing Patterns